
TL;DR:
- Many organizations fail to complete projects on time and within scope because teams focus on activity rather than actual progress. Proper progress measurement reveals early warnings, increases stakeholder trust, and improves resource allocation, ultimately boosting project success rates. Using a few meaningful KPIs and turning data into decisions with real-time dashboards can significantly enhance project outcomes.
Most project managers assume a busy team is a productive team. That assumption costs organizations millions every year. The reality is that only 31 to 35% of projects are completed fully on time, on budget, and within scope. The rest fall behind, go over budget, or fail outright. The gap between effort and outcome usually comes down to one thing: teams track activity instead of real progress. This guide will show you exactly why measurement matters, which methods work best, and how to turn your data into decisions that drive actual project success.
Key Takeaways
| Point | Details |
|---|---|
| Measurement drives success | Teams with strong progress metrics are more likely to deliver successful projects. |
| Choose metrics wisely | Select only 8 to 12 KPIs that reflect real business outcomes, not just activity. |
| Automate for visibility | Automated tools and dashboards make it easy to track, share, and act on progress data. |
| Hybrid approaches win | Combining methods and benchmarking against high performers significantly boosts results. |
| Review and adjust | Regularly reevaluating metrics ensures tracking stays aligned with your project’s real goals. |
Why measuring project progress matters
After highlighting that challenge, it is essential to understand exactly why measuring progress is so critical to project success. Progress measurement is the bridge between effort and results. Without it, you are essentially flying blind, hoping that the work your team completes will eventually add up to the outcomes you promised stakeholders.
Here is why this matters more than most managers realize. When you measure correctly, you shift your team’s focus from completing tasks to achieving goals. A developer who closes 15 tickets in a sprint may feel productive, yet if none of those tickets move the product closer to the customer release milestone, that work has limited value in the broader picture.
There are clear, practical reasons to invest in rigorous measurement:
- Early warning signals. Tracking progress against a schedule lets you spot delays before they compound. A one-week slip caught at week three is far easier to recover from than a three-week slip caught at week nine.
- Stakeholder transparency. Reliable data builds trust. When you can show a client or executive exactly where the project stands, with evidence, conversations become collaborative instead of defensive.
- Team accountability. When milestones are visible and tracked, individual contributors understand how their work connects to the overall goal.
- Smarter resource decisions. Progress data reveals where teams are overloaded or underutilized, enabling better allocation before problems escalate.
The data backs this up strongly. High-performing organizations are 2.5 times more likely to deliver projects on time compared to their lower-performing counterparts. That kind of performance gap does not happen by accident.
“Measurement systems are the strongest single project success factor, but over-measurement creates noise. The goal is clarity, not volume.” Prince2 research on metrics confirms this finding, assigning measurement systems a PMI score of 385, higher than any other success factor examined.
One caution worth raising early: more metrics do not mean more insight. Teams that track every conceivable data point often end up paralyzed by noise. Vanity metrics like total tasks logged or emails sent look impressive on a dashboard but tell you almost nothing about actual progress. Focus instead on a small set of high-signal KPIs (Key Performance Indicators), ideally no more than 8 to 12, that directly reflect movement toward your project’s outcomes. This principle applies equally to multi-partner project management, where too many overlapping metrics can confuse accountability across teams.
Popular methods for tracking project progress
With the “why” covered, it is time to examine how progress can be measured most effectively. The good news is that you have a range of options, from simple approaches that work for smaller projects to sophisticated methods suited for large, complex initiatives.
Here is a quick comparison of the most widely used methodologies:
| Method | Best for | Complexity | Key output |
|---|---|---|---|
| Percent complete | All project types | Low | Simple progress % |
| Milestone tracking | Phased projects | Low to medium | On/off track status |
| Weighted milestones | Multi-phase projects | Medium | Weighted progress score |
| Earned Value Management (EVM) | Cost-critical projects | High | SPI and CPI values |
| Velocity tracking | Agile/sprint teams | Medium | Story points per sprint |
| 50/50 or 0/100 rules | Construction, fixed work | Low | Binary completion status |
Key methodologies like EVM with SPI (Schedule Performance Index) and CPI (Cost Performance Index) give you a mathematically precise picture of whether you are ahead or behind on both time and cost simultaneously. An SPI above 1.0 means you are ahead of schedule. Below 1.0 means you are behind. CPI works the same way for cost. These two numbers together can predict final project cost and completion date with surprising accuracy.
Here is a step-by-step approach to selecting and implementing a tracking method:
- Define your project type. Agile software teams benefit most from velocity. Fixed-scope infrastructure projects suit milestone or EVM tracking.
- Identify key milestones. Break your project into meaningful checkpoints, not just arbitrary dates but real deliverables that represent completed phases.
- Assign weights if needed. For complex projects, not all milestones carry equal importance. A go-live deployment milestone deserves more weight than an internal document review.
- Set your measurement frequency. Weekly updates work for most projects. Fast-moving sprints may need daily check-ins on velocity.
- Automate where possible. Manual data entry introduces errors and delays. Connecting your task management tool to an automated reporting system keeps data current without eating your team’s time.
Pro Tip: If your team is new to EVM, start with a simple percent-complete model for your first two or three projects. Once your team understands the logic of comparing planned versus actual work, introducing SPI and CPI becomes much more intuitive. Use reporting for data clarity to structure how your dashboards present these numbers to different stakeholder audiences.
Physical progress methods are also worth mentioning for teams managing construction or manufacturing-type work. The 0/100 rule means a task gets zero credit until it is fully complete. The 50/50 rule grants 50% credit when work begins and the remaining 50% on completion. These binary approaches eliminate the common trap of tasks sitting at “90% done” for weeks on end.
Choosing meaningful metrics and avoiding common pitfalls
With multiple tools at your disposal, choosing the right ones and using them correctly becomes the next challenge. This is where many teams go wrong, not because they are careless, but because they misunderstand what a metric is actually supposed to tell them.
The single most important distinction you need to know is the difference between leading and lagging indicators:
- Leading indicators predict future performance. Examples include velocity per sprint, number of risks identified and mitigated, and milestone completion rate for the current phase. These are your early warning signals.
- Lagging indicators confirm past results. Examples include final cost variance, total schedule slippage, and customer satisfaction score at project close. These tell you what happened after the fact.
Most teams overload their dashboards with lagging indicators and then wonder why they keep getting surprised by bad news. Lagging metrics are important for learning, but leading metrics are what give you time to act. Metrics and KPIs provide objectivity that gut feel simply cannot match, but you need to choose the right ones for them to be useful.
Here are the most actionable KPIs for project managers at mid-sized to large organizations:
- Milestone achievement rate: What percentage of planned milestones were hit on time? This single number often predicts final project success better than any other indicator.
- Schedule Performance Index (SPI): Are you getting the planned amount of work done for the time you have spent?
- Cost Performance Index (CPI): Are you delivering value relative to the budget consumed?
- Resource utilization rate: Are team members working at a sustainable pace, or are key contributors at 120% capacity heading toward burnout?
- Defect rate or rework percentage: How much completed work is coming back for revision? High rework rates signal quality problems that will slow your final delivery.
- Risk burndown: Are identified project risks being closed out as the project progresses, or is the risk register growing?
Pro Tip: Review your KPI set at the start of each project phase, not just at the beginning of the project. A metric that was meaningful in the planning phase may be irrelevant during execution. Staying aligned on metrics for alignment across departments also matters here, especially when multiple business units have a stake in a project’s outcome.
Avoid the temptation to add new metrics every time something goes wrong. Instead, ask whether your existing metrics, if reviewed more frequently or with more discipline, would have caught the problem earlier. More often than not, the answer is yes.

From tracking to action: Making metrics drive results
Now that you have selected the right metrics, the final step is turning that data into decisions that actually improve team and project performance. Data without action is just administration.
Here is what the numbers tell us about the value of doing this well:
| Practice | Impact on success rate |
|---|---|
| Mature PMO in place | +38% improvement |
| Hybrid measurement methods | +19% improvement |
| Regular metric reviews tied to meetings | Reduced late detection of issues |
| Automated real-time dashboards | Faster course correction |
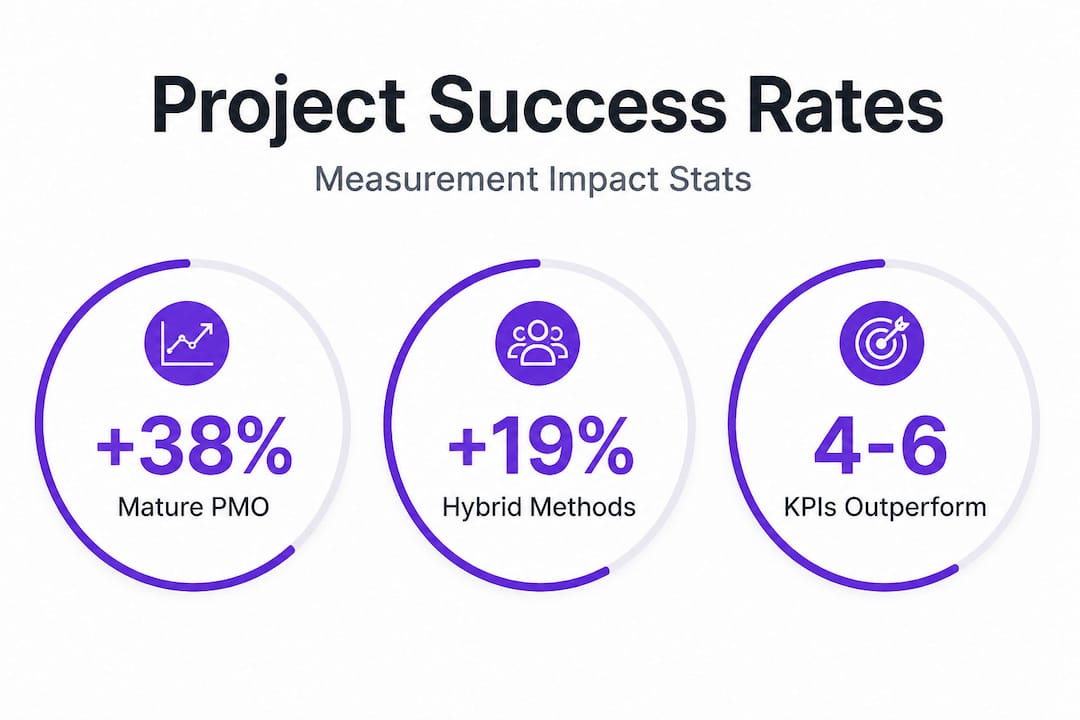
Mature PMOs (Project Management Offices) boost overall project success rates by 38%, and teams using hybrid measurement methods see a 19% lift in outcomes. These are not marginal gains. They represent a fundamental difference in how well-managed organizations approach project delivery.
To turn tracking into action, follow these steps:
- Connect dashboards to team meetings. Your weekly project review should open with a look at SPI, CPI, and milestone status. This sets the tone that data guides the conversation, not just opinion.
- Assign ownership for each KPI. When a metric slips, someone specific should own the recovery plan. Shared accountability often means no accountability.
- Use trend data, not just snapshots. A single week of poor velocity may reflect a public holiday. Three consecutive weeks of declining velocity is a signal worth acting on.
- Set realistic benchmarks. Use PMI standards and your own historical project data to define what “on track” actually looks like for your organization, not some idealized external benchmark.
- Review and retire outdated metrics. If a metric has been green for three months and no one ever discusses it, it is probably not adding value. Free up dashboard space for something more relevant.
“The goal is not to report progress. The goal is to use progress data to make better decisions faster.” This is the mindset that separates teams that consistently deliver from teams that consistently scramble.
For prime contractor roles in IT modernization projects, this approach becomes even more critical because delays in one workstream can cascade across multiple dependent teams. Real-time visibility is not a luxury in those environments; it is a requirement.
Our perspective: Why most teams misunderstand progress and how to get it right
Here is an uncomfortable truth that most project management guides skip over. The teams that struggle most with progress measurement are not lacking tools or data. They are lacking honesty.
Busy feels like progress. When your team is in back-to-back meetings, responding to Slack messages, and closing tickets, it genuinely looks and feels like things are moving forward. But activity and progress are not the same thing. A team can be fully occupied for three weeks and be no closer to delivering a working product than they were at the start of the sprint.
The best project managers we have seen work with share a common habit: they regularly challenge their own metrics. Not to find fault, but to ask honestly whether the numbers reflect what actually matters to the business. If your project dashboard shows all green but your sponsor is still anxious, something is being measured poorly. That anxiety is data too.
Fewer, better chosen KPIs consistently outperform large, unwieldy metric sets. Teams that focus on four to six truly meaningful indicators spend less time in status reporting and more time on real problem-solving. They catch issues earlier. They course-correct faster. And they end up with better outcomes, not because they worked harder but because they were looking at the right signals.
The goal is not a perfect dashboard. The goal is a team that responds intelligently to what the data reveals. Start there, and the right measurement approach will follow naturally.
See and accelerate your team’s real project progress
If the methods in this guide resonate with you, the next step is putting them into practice with tools built for exactly this purpose. Visibility, accountability, and real-time data should not require hours of manual reporting each week.

Gammatica gives project managers and team leaders the dashboards, automation, and collaboration tools they need to measure what matters and act on it quickly. From Kanban-based task views to automated milestone tracking and team performance reports, everything you need to move from activity tracking to genuine outcome measurement is in one place. Explore project progress dashboards to see how real-time visibility can transform how your team delivers. Stop managing by feel and start managing with evidence.
Frequently asked questions
What is the difference between activity tracking and true project progress?
Activity tracking counts tasks completed, while true progress measures movement toward goals and business outcomes. A team can complete hundreds of tasks without actually advancing the project toward its intended result.
How many project KPIs should I track?
Focus on 8 to 12 actionable KPIs for effective monitoring without creating noise or overloading your team with irrelevant data.
What are leading and lagging indicators in project measurement?
Leading indicators predict future performance, such as velocity or risk mitigation rate, while lagging indicators confirm what has already happened, like final cost variance or total schedule slippage.
How does using hybrid measurement methods affect success rates?
Projects using hybrid measurement approaches see up to a 19% improvement in overall success rates compared to teams relying on a single methodology.
Why do mature PMOs see higher project success?
Mature PMOs increase project success by 38% overall because they bring structured measurement, standardized processes, and consistent accountability to every project they oversee.