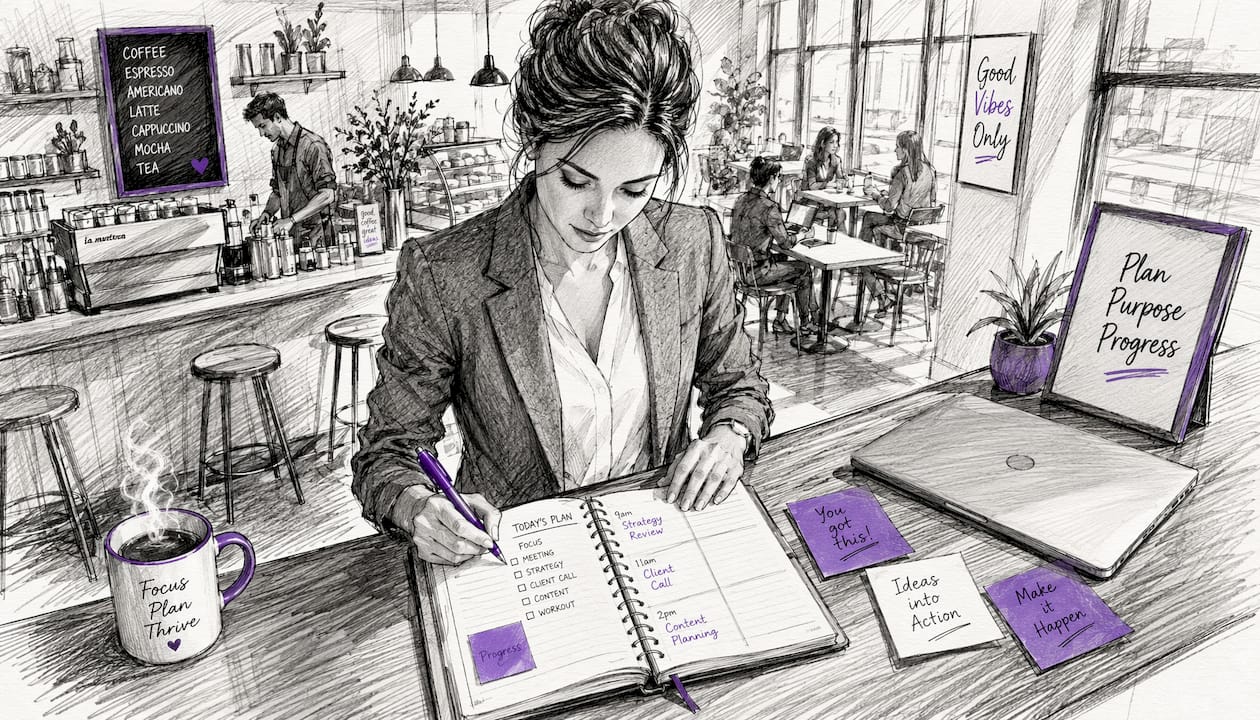
Project delays often stem from poor scheduling or unclear responsibilities, yet teams using Gantt charts report up to 40 percent fewer missed deadlines. Staying organized matters more as projects become complex and deadlines tighten. Learning how Gantt charts clearly map tasks and dependencies can help you sidestep confusion, boost coordination, and keep even the most demanding projects on track.
Table of Contents
- Defining Gantt Charts And Core Concepts
- Types Of Gantt Charts In Project Management
- Key Features And How Gantt Charts Work
- Applying Gantt Charts To Real-World Projects
- Common Challenges And Mistakes To Avoid
Defining Gantt Charts and Core Concepts
A Gantt chart is a powerful visual project management tool that transforms complex scheduling into an intuitive, easy-to-understand format. According to Wikipedia, it is a type of bar chart that illustrates a project schedule by displaying tasks vertically and time intervals horizontally. Think of it as a strategic roadmap that lets you see your entire project timeline at a single glance.
At its core, a Gantt chart breaks down project complexity by representing each task as a horizontal bar. The length of the bar indicates the task’s duration, while its position shows when the task starts and ends. This visual representation allows project managers to quickly understand task sequences, potential overlaps, and critical path dependencies. Modern Gantt charts have evolved beyond simple timelines to include advanced features like task relationships, progress tracking, and resource allocation.
Key components of a typical Gantt chart include:
- Vertical Axis: Lists all project tasks or activities
- Horizontal Axis: Represents the total project timeline, often broken down into days, weeks, or months
- Task Bars: Horizontal bars showing each task’s start date, duration, and end date
- Dependency Connections: Lines or arrows indicating how tasks relate to and impact each other
- Progress Indicators: Visual markers showing completion percentage of each task
By providing a clear, visual snapshot of project timelines, Gantt charts help teams coordinate efforts, identify potential bottlenecks, and maintain a strategic overview of complex projects. Whether you’re managing a small team project or coordinating a large-scale enterprise initiative, understanding Gantt charts can significantly enhance your project planning and execution capabilities.
Types of Gantt Charts in Project Management
Project management demands flexibility, and Gantt charts have evolved to meet diverse organizational needs. Different types of Gantt charts serve specific purposes, ranging from simple task tracking to complex, multi-dimensional project visualization. Understanding these variations can help teams select the most appropriate chart for their unique project requirements.
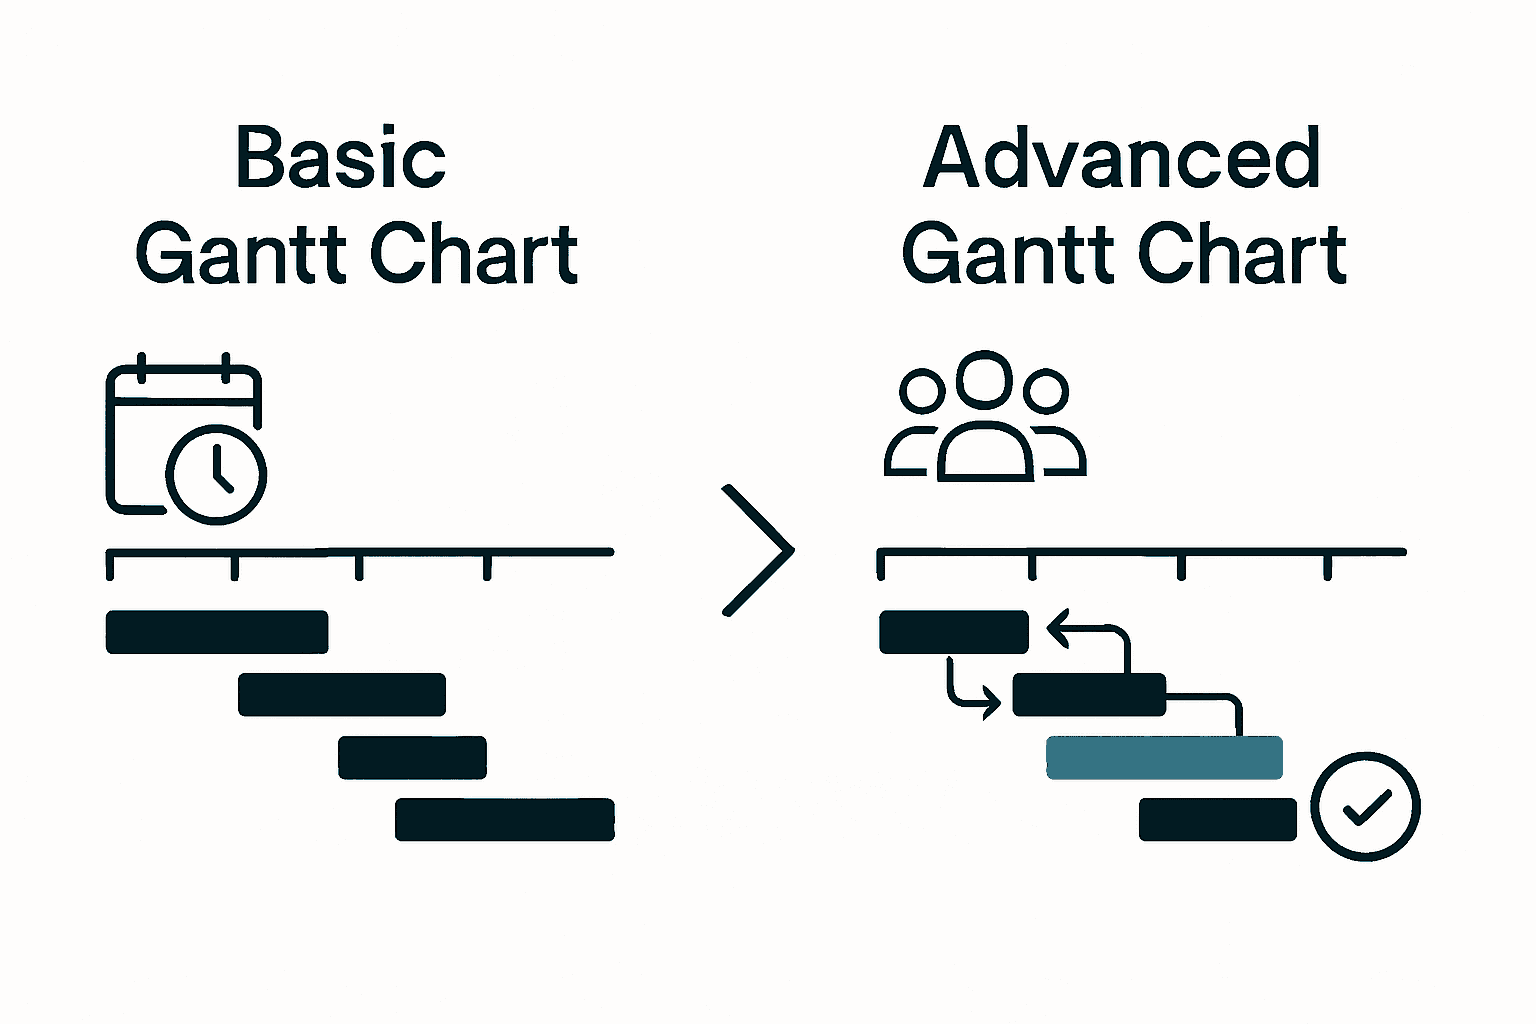
Traditional Project Gantt Charts
Traditional Gantt charts remain the foundational model for project scheduling. These charts focus on basic task sequencing, displaying individual tasks as horizontal bars with clear start and end dates. They excel at showing linear project progression, making them ideal for straightforward projects with predictable workflows. Small teams and startup environments often rely on these classic representations to maintain project clarity and track overall progress.
Advanced Resource Management Gantt Charts
More sophisticated Gantt charts integrate resource allocation and management capabilities. These charts go beyond simple timeline tracking by incorporating:
- Resource Availability: Visualizing team member workload and capacity
- Skill Mapping: Matching team members’ expertise with specific project tasks
- Capacity Planning: Understanding potential overallocation or underutilization of team resources
- Workload Balancing: Identifying and resolving potential scheduling conflicts
Specialized Industry-Specific Gantt Charts
Certain industries have developed highly customized Gantt chart variants tailored to their unique project management challenges:
- Construction Project Charts: Emphasize equipment scheduling and material procurement timelines
- Software Development Charts: Include sprint tracking and agile methodology integration
- Event Planning Charts: Focus on vendor coordination and milestone dependencies
- Manufacturing Charts: Highlight production sequences and supply chain interactions
The beauty of modern Gantt charts lies in their adaptability.
 While the core principle remains consistent visual project timeline representation, these specialized versions demonstrate how a simple charting tool can transform into a powerful strategic planning instrument across different professional domains.
Key Features and How Gantt Charts Work
Understanding the intricate mechanics of Gantt charts is crucial for effective project management. According to Wikipedia, these powerful visual tools encompass key features including task planning, allocation, timelines, dependencies, and progress tracking. Essentially, Gantt charts transform complex project details into a clear, intuitive visual representation that teams can easily comprehend and navigate.
Core Functional Mechanics
At the heart of a Gantt chart’s functionality lies its unique ability to break down projects into manageable components. Each horizontal bar represents a specific task, with its length corresponding to the task’s duration and its position indicating precise start and end dates. This visual approach allows project managers to see not just individual task timelines, but also how different tasks interconnect and potentially impact one another.
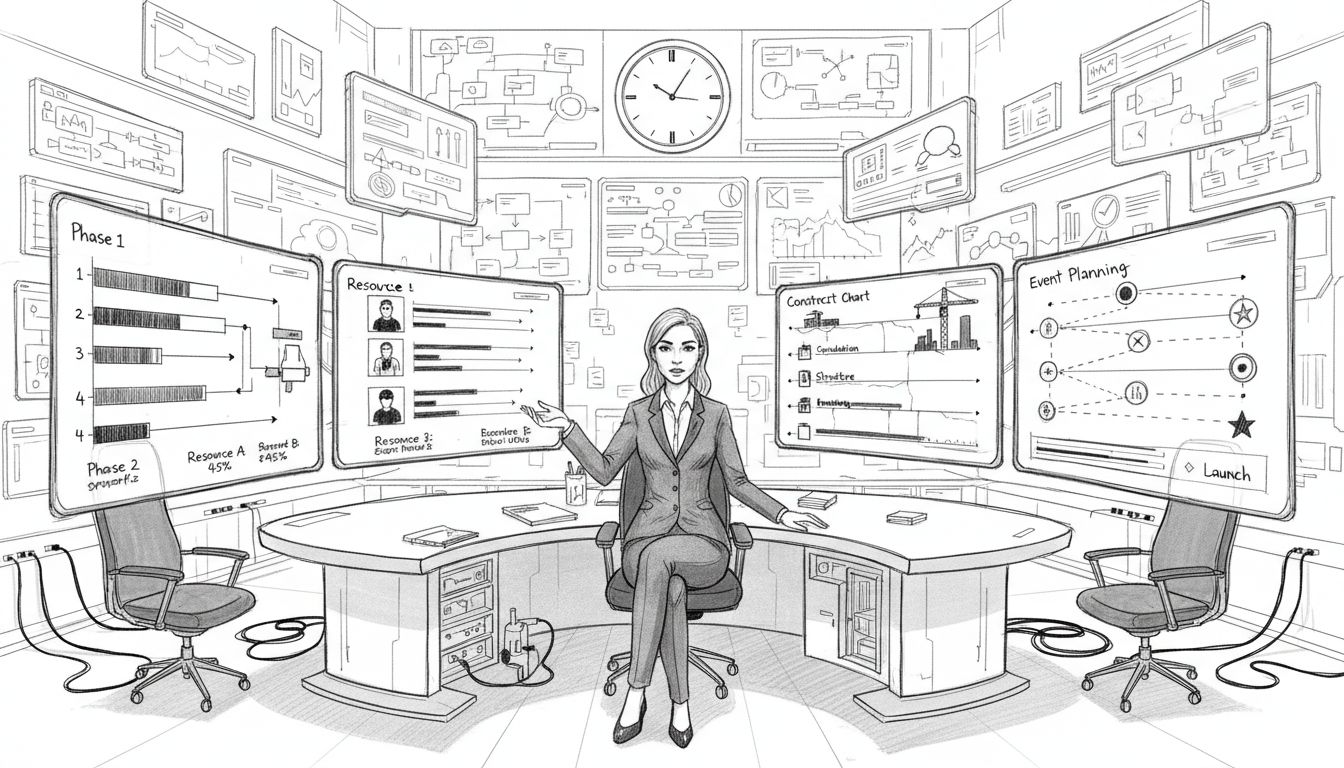
Advanced Tracking and Visualization Features
Modern Gantt charts offer sophisticated tracking capabilities that go beyond basic timeline representation:
- Task Dependencies: Visualize how one task’s completion affects subsequent tasks
- Critical Path Identification: Highlight the most time-sensitive project elements
- Resource Allocation: Show which team members are assigned to specific tasks
- Progress Percentage: Indicate real-time completion status for each project component
Interactive and Dynamic Project Management
Today’s digital Gantt charts have evolved into interactive tools that provide real-time updates and collaborative features. Project managers can now adjust timelines dynamically, reassign resources instantly, and provide immediate visibility into project status. This level of flexibility transforms Gantt charts from static planning documents into living, breathing project management instruments that adapt to changing organizational needs.
By combining visual clarity with detailed tracking capabilities, Gantt charts have become an indispensable tool for teams seeking to streamline project execution, improve communication, and maintain strategic oversight across complex initiatives.
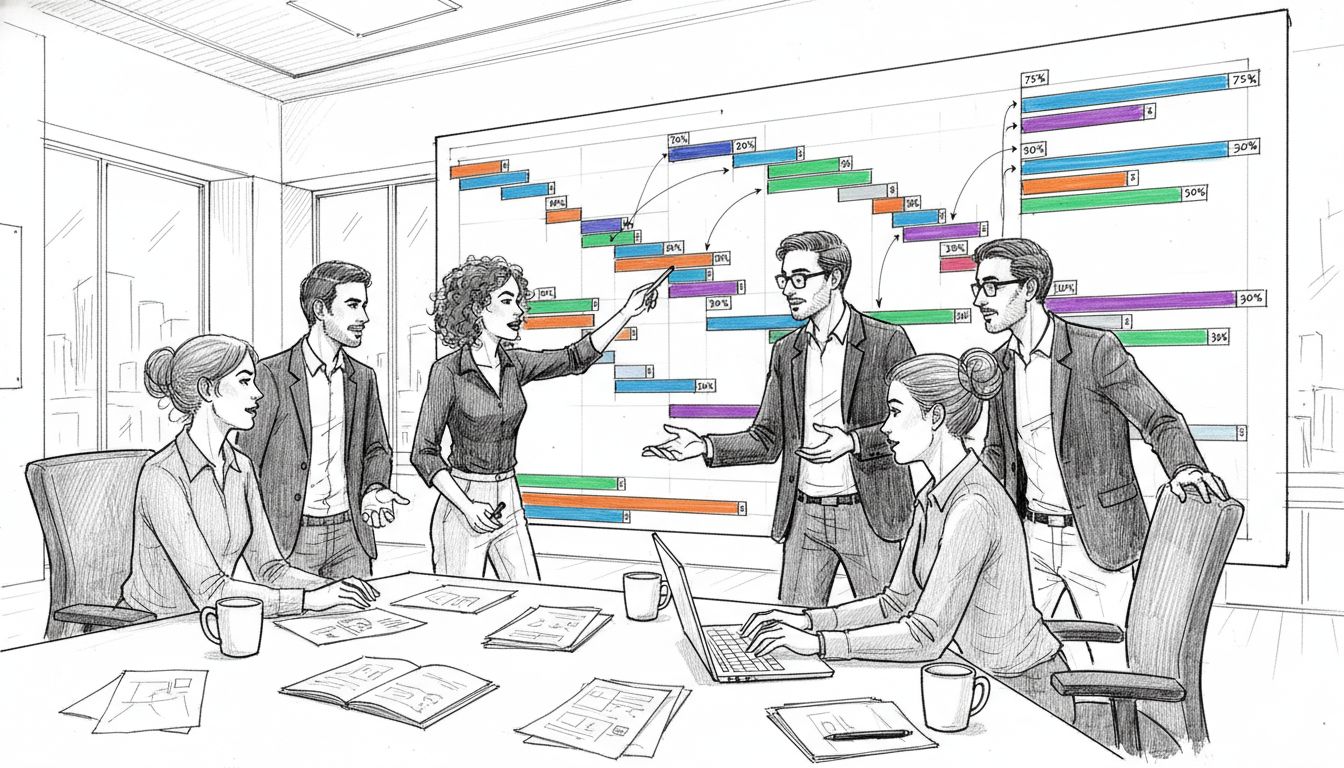
Applying Gantt Charts to Real-World Projects
Gantt charts are not just theoretical tools but powerful practical instruments for solving complex project challenges across various industries. Modern applications have transformed these charts from simple scheduling aids into sophisticated project management solutions. Innovative research demonstrates their remarkable potential, such as the Fabric-GC system, which shows how Gantt charts can enable cross-organizational project management using advanced technologies like blockchain for secure collaboration and visualization.
Industry-Specific Project Applications
Different sectors leverage Gantt charts uniquely to address their specific project management needs. In construction, these charts help track equipment procurement, material delivery, and sequential construction phases. Software development teams use Gantt charts to map out sprint cycles, feature releases, and development milestones. Event planners rely on them to coordinate vendor schedules, venue preparations, and logistical dependencies.
Cross-Organizational Collaboration
According to arXiv, advanced Gantt chart systems like Fabric-GC are revolutionizing how multiple organizations collaborate on complex projects. These systems provide:
- Secure Access Controls: Ensuring only authorized personnel view specific project details
- Real-Time Visualization: Allowing instantaneous updates across organizational boundaries
- Transparent Tracking: Creating accountability and clear communication channels
- Blockchain Integration: Guaranteeing data integrity and preventing unauthorized modifications
Strategic Implementation Strategies
Successful Gantt chart application requires more than just technical implementation. Project managers must develop strategic approaches that include:
- Detailed task breakdown
- Realistic time estimations
- Clear responsibility assignments
- Continuous monitoring and adjustment
- Integrated communication protocols
By transforming complex project landscapes into clear, actionable visual representations, Gantt charts help teams navigate intricate challenges with unprecedented clarity and coordination.
Common Challenges and Mistakes to Avoid
Creating and maintaining effective Gantt charts is more complex than simply plotting tasks on a timeline. Project managers frequently encounter significant obstacles that can derail their planning and execution. According to arXiv, one critical challenge involves managing communication in large-scale project execution, where dense visualizations can potentially obscure important patterns and relationships.
Visualization and Complexity Pitfalls
As projects grow in complexity, Gantt charts can become overwhelmingly intricate. The risk of creating a chart so dense that it becomes unreadable is real. This happens when teams try to include too much granular detail, leading to visual noise that defeats the chart’s primary purpose of providing clear, strategic overview. Successful Gantt chart design requires a delicate balance between comprehensive information and visual clarity.
Common Strategic Mistakes
Project managers often fall into predictable traps when developing Gantt charts:
- Unrealistic Time Estimations: Underestimating task duration leads to cascading schedule disruptions
- Ignoring Task Dependencies: Failing to account for how tasks interconnect
- Lack of Flexibility: Creating rigid charts that cannot adapt to unexpected changes
- Insufficient Regular Updates: Treating the Gantt chart as a static document instead of a dynamic tool
Scalability and Communication Challenges
Research highlights the critical need for scalable representations in project management visualizations. As projects expand, Gantt charts must evolve to maintain their effectiveness. This means:
- Developing dynamic filtering mechanisms
- Creating hierarchical views
- Implementing interactive elements
- Enabling quick drill-down capabilities
By anticipating these challenges and proactively designing more intelligent, adaptive Gantt charts, project managers can transform potential obstacles into opportunities for enhanced team coordination and strategic planning.
Simplify Your Project Planning with AI-Driven Management
Managing complex projects with Gantt charts can quickly become overwhelming as timelines stretch and task dependencies increase. If you find yourself struggling with unrealistic time estimates, dense visualizations, or difficulties in adapting plans dynamically, you are not alone. This article highlights these common challenges and the importance of clear visualization, task dependencies, and progress tracking for keeping projects on course.

Experience how Gammatica.com transforms project planning by combining Gantt chart principles with AI-powered automation. Our platform helps you break down tasks, track real-time progress, and manage resource allocations effortlessly. With features like calendar coordination, Kanban boards, and team collaboration tools, you will reduce administrative burdens and free up valuable time. Take control of your project timelines today with an intelligent solution that grows with your team. Start your journey towards seamless project management now at Gammatica.com.
Frequently Asked Questions
What is a Gantt chart?
A Gantt chart is a visual project management tool that illustrates a project schedule by displaying tasks vertically and time intervals horizontally, allowing for easy tracking of task durations and relationships.
How do Gantt charts help in project management?
Gantt charts help project managers visualize task sequences, identify potential bottlenecks, and facilitate coordination among team members, enhancing overall project planning and execution.
What are the key components of a Gantt chart?
Key components of a Gantt chart include a vertical axis for listing tasks, a horizontal axis for the project timeline, task bars representing durations, dependency connections, and progress indicators to show completion status.
What are the different types of Gantt charts?
Different types of Gantt charts include traditional project Gantt charts for basic task tracking, advanced resource management Gantt charts for tracking resources, and industry-specific Gantt charts designed for fields such as construction, software development, and event planning.