Picking the right project management tool for 2025 is more than a technical decision—it can reshape a team’s effectiveness from the ground up. Here’s the twist. While timelines are great for quick overviews, Gantt charts can show intricate task dependencies and progress at a glance—features that over 70 percent of high-performing teams say are essential. So before you stick with what’s familiar, you might want to see how the right choice could make or break your next big project.
Table of Contents
- Understanding Gantt Chart And Timeline Basics
- Key Differences And Use Cases Explained
- Choosing The Right Tool For Your Team
- Best Practices For Project Success In 2025
Quick Summary
| Takeaway | Explanation |
|---|---|
| Gantt charts provide detailed project visibility | Gantt charts are essential for visualizing complex project schedules, showing task dependencies, durations, and progress at a glance, which aids in project management. |
| Timelines offer high-level overviews | Timelines are effective for conveying simple project progressions and milestones, making them suitable for executive presentations and strategic planning without detailed task management. |
| Evaluate team needs for tool selection | Choosing between Gantt charts and timelines should be based on project complexity, team size, and communication requirements, emphasizing the importance of assessing unique team workflows. |
| Integrate technology for enhanced collaboration | Utilizing real-time collaboration tools and AI can significantly improve project tracking and risk management, positioning teams for success in the evolving landscape of project management. |
| Adopt adaptive methodologies for continuous improvement | Embracing iterative approaches and consistent performance reviews fosters a culture of adaptability, allowing teams to respond effectively to changing project dynamics. |
Understanding Gantt Chart and Timeline Basics
Project management requires powerful visual tools that transform complex schedules into clear, actionable plans. A Gantt chart emerges as a critical instrument for professionals seeking to navigate project timelines with precision and clarity.
What is a Gantt Chart?
A Gantt chart is a sophisticated bar chart that provides a comprehensive visual representation of project schedules. According to Wikipedia, these charts illustrate tasks on the vertical axis and time intervals on the horizontal axis, with each task represented by a horizontal bar indicating its duration and relationship to other project elements.
The power of a Gantt chart lies in its ability to communicate complex project information at a glance. Project managers can quickly understand task sequences, dependencies, start and end dates, and overall project progression. This visual approach transforms abstract timelines into tangible, easy-to-comprehend graphics that keep teams aligned and focused.
Key Components of Effective Gantt Charts
Research from project management experts reveals several critical components that make Gantt charts highly effective:
- Task List: A comprehensive inventory of all project activities
- Timeline Axis: Horizontal representation of project duration
- Task Bars: Horizontal bars showing task length and timing
- Dependency Arrows: Illustrating connections between related tasks
- Progress Indicators: Visual markers showing task completion status
- Milestone Markers: Highlighting significant project moments
Strategic Applications in Project Management
Experts from Minnesota’s Health Department emphasize that Gantt charts are particularly valuable when project steps, sequences, and durations are well-defined. They serve multiple strategic purposes beyond simple scheduling:
- Communicating project plans to stakeholders
- Tracking real-time project progress
- Identifying potential bottlenecks
- Managing resource allocation
- Facilitating team coordination
By transforming complex timelines into clear, visual narratives, Gantt charts empower teams to move from confusion to coordinated action. Whether managing small team projects or large organizational initiatives, these tools provide the transparency and structure needed to drive successful outcomes.
Key Differences and Use Cases Explained
Navigating project management tools requires understanding the nuanced differences between Gantt charts and timelines. While they might appear similar at first glance, these visualization techniques serve distinct purposes and offer unique advantages for different project scenarios.
Structural Characteristics and Visual Representation
Gantt Charts represent a more complex and detailed visualization compared to standard timelines. According to ProjectManager.com, Gantt charts provide intricate details about task dependencies, progress tracking, and resource allocation. Unlike simple timelines that merely display chronological events, Gantt charts incorporate horizontal bars representing task duration, interconnected relationships between tasks, and precise start and end dates.
Timelines, in contrast, offer a streamlined view of project milestones and key events. They excel at presenting a high-level overview that quickly communicates project progression without delving into granular task management details. This makes timelines particularly effective for executive presentations, strategic planning, and communicating broad project trajectories.
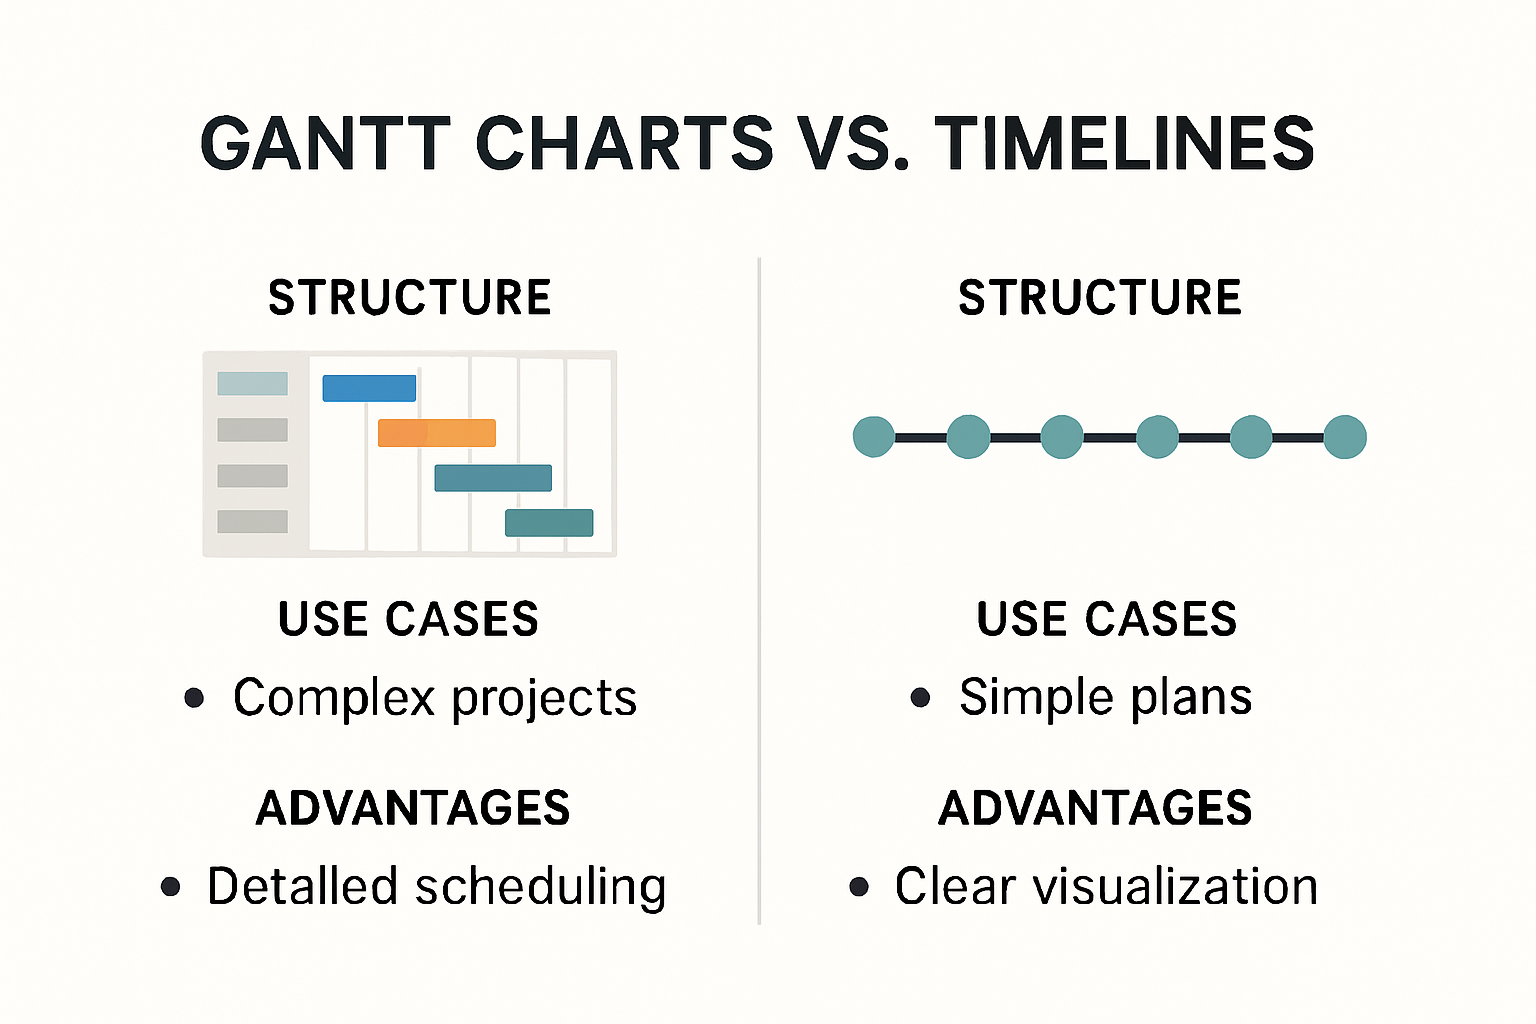
Here’s a table summarizing key structural and visual differences between Gantt charts and timelines to help clarify their most important distinctions:
| Feature | Gantt Chart | Timeline |
|---|---|---|
| Visual Layout | Bar chart with tasks over time | Linear sequence of events or milestones |
| Task Dependencies Shown | Yes (with arrows/links) | No |
| Detail Level | High (shows tasks, durations, dependencies) | Low (shows key dates/milestones only) |
| Progress Tracking | Detailed (percentage complete, progress bars) | Limited |
| Best For | Complex, multi-step projects | Simple, linear or executive overviews |
| Resource Allocation | Shown (assign tasks/resources) | Not shown |
| Ease of Comprehension | Moderate (more complex but comprehensive) | Very easy (high-level, simplified) |
Strategic Use Cases and Project Complexity
Research from the Project Management Institute highlights the strategic applications of these visualization tools across different project management scenarios:
-
Gantt Charts: Ideal for
- Complex projects with multiple interdependent tasks
- Software development initiatives
- Construction and engineering projects
- Manufacturing process planning
- Resource-intensive initiatives requiring detailed tracking
-
Timelines: Best suited for
- Marketing campaign planning
- Product launch strategies
- Historical event documentation
- Strategic roadmap presentations
- Simple, linear project sequences
Technical Capabilities and Flexibility
The technical sophistication of Gantt charts sets them apart as a more advanced project management tool. They offer capabilities that extend beyond basic event tracking. These include percentage completion indicators, critical path identification, potential bottleneck visualization, and real-time progress monitoring.
Timelines, while less technically complex, provide unparalleled clarity for communicating sequential events. Their simplicity becomes an advantage when stakeholders require a quick, intuitive understanding of project flow without getting lost in intricate details.
Understanding these differences empowers project managers to select the most appropriate visualization tool. The choice depends on project complexity, stakeholder needs, and the specific communication objectives. Whether you require detailed task management or a high-level strategic view, both Gantt charts and timelines offer valuable insights into project dynamics.
Choosing the Right Tool for Your Team
Selecting the appropriate project management visualization tool is not a one-size-fits-all decision. Teams must carefully evaluate their specific needs, project complexity, and organizational workflow to make an informed choice between Gantt charts and timelines.
Assessing Team Workflow and Project Requirements
According to LaunchNotes, understanding your team’s unique characteristics is crucial in tool selection. Small teams with linear projects might find timelines more intuitive, while complex organizational structures benefit from the detailed tracking capabilities of Gantt charts.
Key factors to consider include project complexity, team size, communication needs, and the level of detail required for stakeholder reporting. Some teams might even benefit from using both tools simultaneously for different aspects of project management.
Evaluating Tool Flexibility and Adaptation
Research from ResearchGate highlights the evolving nature of project management tools. Modern teams require solutions that can adapt to changing project dynamics:
- Agile Methodology Compatibility: Some traditional Gantt charts struggle with rapid iterations
- Real-time Collaboration Features: Ability to update and share progress instantly
- Integration with Other Project Management Systems
- Customization Options
- Scalability Across Different Project Types
Below is a table that summarizes critical evaluation criteria when selecting a visualization tool, aiding in systematic comparison and decision-making:
| Evaluation Criteria | Gantt Chart | Timeline |
|---|---|---|
| Handles Complex Dependencies | Yes | No |
| Real-Time Collaboration Features | Often (modern tools) | Sometimes |
| Agile Workflow Compatibility | Sometimes (varies) | Yes |
| Integration with Other Systems | Yes | Yes |
| Customization Options | High | Moderate |
| Scalability for Project Types | High | Low to Moderate |
| Ease of Setup and Use | Moderate | High |
Decision-Making Framework
Developing a systematic approach to tool selection involves a comprehensive evaluation:
- Analyze current project management challenges
- Map out specific visualization needs
- Compare tool features against team requirements
- Consider budget and implementation complexity
- Test tools with small pilot projects
Projects with multiple interconnected tasks and strict dependencies typically demand Gantt charts. Conversely, projects requiring quick communication and high-level overviews are better served by timelines.
Ultimately, the right tool should simplify project management, not complicate it. Teams must prioritize tools that enhance communication, improve tracking, and ultimately drive project success. The most effective solution often emerges from understanding your team’s unique workflow and selecting a tool that feels natural and intuitive.
Best Practices for Project Success in 2025
As project management evolves, teams must adapt their strategies to leverage emerging technologies and methodologies. The landscape of project management in 2025 demands a more integrated, flexible, and data-driven approach to achieving successful outcomes.
Strategic Planning and Objective Alignment
According to the Project Management Institute, successful projects begin with crystal-clear objective setting. Modern project managers must create a comprehensive framework that connects individual tasks to overarching organizational goals. This approach ensures that every element of the Gantt chart or timeline directly contributes to strategic priorities.
Effective planning involves more than just listing tasks. Teams need to develop a holistic view that considers:
- Organizational strategic objectives
- Resource availability
- Potential risk factors
- Long-term impact of project deliverables
Leveraging Technology and Collaborative Tools
Research from Deloitte emphasizes the critical role of technology in modern project management. The most successful teams in 2025 will integrate advanced tools that offer:
- Real-time Collaboration: Platforms enabling instant communication and updates
- AI-Powered Predictive Analytics: Tools that forecast potential project risks
- Automated Progress Tracking: Systems that provide immediate insights into project health
- Adaptive Workflow Management: Flexible tools that can quickly respond to changing project dynamics
Continuous Improvement and Adaptive Methodologies
Project success in 2025 requires a mindset of continuous learning and adaptation. Teams must move beyond traditional linear approaches and embrace more dynamic project management strategies. This involves:
- Regular performance reviews
- Proactive risk management
- Iterative approach to project development
- Transparent communication channels
- Ongoing skill development for team members
The most effective project managers will create environments that balance structured planning with the flexibility to pivot when necessary. This means developing Gantt charts and timelines that are living documents rather than static representations.
Ultimately, project success in 2025 is about creating a holistic approach that combines technological innovation, strategic thinking, and human-centric collaboration. Teams that can effectively balance these elements will be best positioned to deliver exceptional results in an increasingly complex and dynamic business environment.
Frequently Asked Questions
What is a Gantt chart and how is it used in project management?
A Gantt chart is a visual tool that represents project schedules, displaying tasks on the vertical axis and time intervals on the horizontal axis. It shows task dependencies, durations, and overall project progress, making it essential for complex projects.
When should I use a timeline instead of a Gantt chart?
Timelines are best for simple, linear projects or when communicating high-level overviews and milestones to stakeholders. They provide clarity without the complexity of task dependencies and detailed progress tracking found in Gantt charts.
How do I choose between a Gantt chart and a timeline for my project?
Choose a Gantt chart for complex projects with multiple interdependent tasks requiring detailed tracking and progress updates. Opt for a timeline when you need a straightforward overview of major milestones and events that is easy to communicate.
What are the best practices for using Gantt charts and timelines in 2025?
Best practices include aligning project objectives with organizational goals, leveraging collaborative technology for real-time updates, and adopting adaptive methodologies that allow for continuous improvement and flexibility throughout the project lifecycle.
Take Control of Project Complexity with Gammatica
Struggling to choose between detailed Gantt charts and streamlined timelines for your team’s evolving needs? You are not alone. Many teams find it hard to balance transparency, task management, and real-time collaboration when complex projects are underway. The article highlighted the need for integrated tools that adapt as your project demands grow and shift. This is where Gammatica steps in to solve pain points like scattered information, manual updates, and limited visibility into team progress.

Unleash your team’s productivity with a platform built for the challenges of 2025. Gammatica combines advanced automation, dynamic task tracking, and easy-to-use visual features. Enjoy comprehensive workflow management with ready-to-use templates, calendar integration, and task dependency mapping, all designed to help you free up to 16 hours per week. If you are seeking to move from confusion to clarity, visit Gammatica’s homepage now. Start streamlining task management and make your next project a real success. Don’t settle for static tools when real results are within reach. Explore how Gammatica gives your team the flexibility and insights you need for every project stage.